Fantasy basketball (referred to as “Fantasy”) is becoming more and more popular, and those who can make good predictions of player performance can win a lot of money. Making good predictions is hard due to differences between NBA and Fantasy. Not all good players generate good statistics, and it is very hard to sift through personal bias and public hype to see who is better objectively.
I will examine these differences using R’s packages dplyr and ggvis. I will use 2 datasets from the following sources:
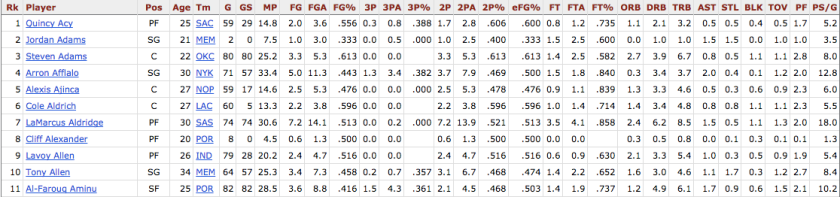
- Player stats for all players in the past season: http://www.basketball-reference.com/leagues/NBA_2016_per_game.html (dataset name is “player” in code). The dataset looks roughly like this:
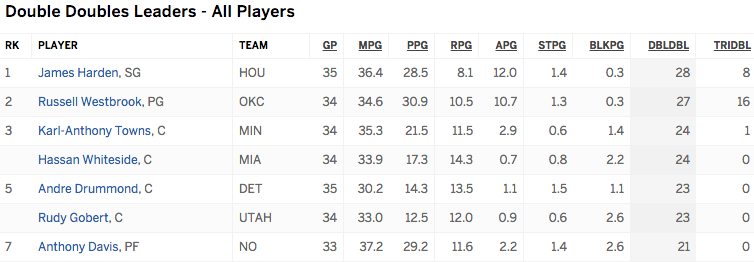
- Double-double and triple-double stats in the past season: http://espn.go.com/nba/statistics/player/_/stat/double-doubles/sort/doubleDouble (dataset name is “ddtd” in code). Due to the difficulty of balancing double-doubles vs triple-doubles, some of the numbers in rank are missing. The dataset looks roughly like this:
I will calculate a player’s average worth per game in fantasy basketball over the course of the ’15-’16 season in DraftKings and FanDuel.
Let’s begin.
I open R studio and load the libraries I need.
library(dplyr)
library(ggvis)
I then import my datasets and calculate a player’s worth. I simply copied and pasted the datasets from the website and imported manually, instead of performing web-scraping in R, for the sake of this post. Calculations simply multiple the score of an associated statistic (like an assist or a rebound) with the number of occurrences of that statistic for a player. For example, if player A have only 5 assists, then player A’s Fantasy score would be 5 multiplied by the score associated with an assist, which is 1.5.
DraftKings also gives points for double-double and triple-double performances, which is when a player have 10 or more occurrences in two (double-double) or three (triple-double) categories. The following code chunk addresses all of these issues.
names(player) = player[1,]
#This assigns names to columns of player dataset

for (i in 1:nrow(player)) {
if (toString(player[i,1]) == "Rk") {
        player = player[-i,]
    }
}
#eliminates extra rows containing column names that we don't need

for (i in 1: nrow(ddtd)) {
if (toString(ddtd[i,1]) == "RK") {
        ddtd = ddtd[-i,]
    }
}
#eliminates extra rows again in ddtd dataset

names(player)[12] = "Threes"
#original column name is "3s" which is hard to reference in R
#this makes it easier to reference in future

player = player %>% select(Player, G, Threes, TRB, AST, STL, BLK, TOV, PTS)
#select relevant columns

player$dd = 0
player$td = 0
ddtd = ddtd %>% select(V2,V11,V12)
#prepares to merge ddtd and player dataset for calculation

row.names(player) = 1:nrow(player)
row.names(ddtd) = row.names(ddtd)
for (i in 1:nrow(ddtd)) {
for (j in 1:nrow(player)) {
        if (strsplit (ddtd[i,1],",")[[1]][1] == player$Player[j]) {
            player$dd[j] = ddtd$V11[i]
            player$td[j] = ddtd$V12[i]
        }
}
}
player$td[is.na(player$td)] = 0
#merges player and ddtd dataset and removes NA's

for (i in 2:ncol(player)) {
    player[,i] = as.numeric(player[,i])
}
#converts entire dataset to numeric type for calculations

player = player %>% mutate(tdd = dd/G, ttd = td/G)
#converts double-doubles and triple-doubles to a per game basis

player = player %>% mutate(
dk = PTS + 0.5*Threes + 1.25*TRB + 1.5*AST + 2*STL + 2*BLK - 0.5*TOV + 1.5 * tdd + 3*ttd,
fd = PTS + 1.2*TRB + 1.5*AST + 2*STL + 2*BLK - TOV)
#calculates player's worth using DraftKing and FanDuel scoring

player = player %>% arrange(desc(dk))
#rearranges dataset by players in descending value order
The final result of “player” dataset will look something like this.
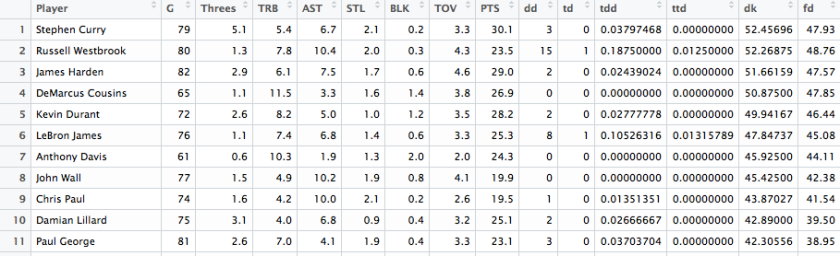
Each player’s worth in DraftKings is displayed in the “dk” column and FanDuel in the “fd” column. Players are arranged in descending value order, so we immediately see who are the most valuable players in the 2015-2016 season in Fantasy. Expectedly, Stephen Curry is at the top of that list.
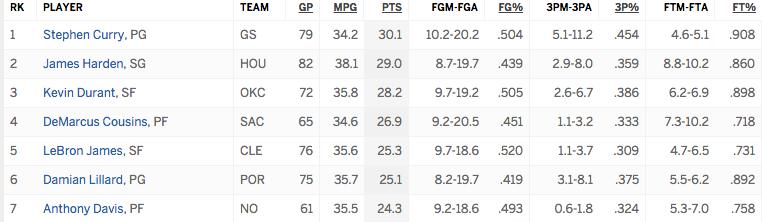
In real life, people place more emphasis on scoring, so we will compare our player dataset ranking to the scoring rankings of the ’15 to ’16 season. This scoring ranking can be obtained from the following source:
- Scoring leaders ranking: http://www.espn.com/nba/statistics/player/_/stat/scoring-per-game/sort/avgPoints/year/2016. The dataset looks something like this: